Inferencing Engine — Harness and Observability
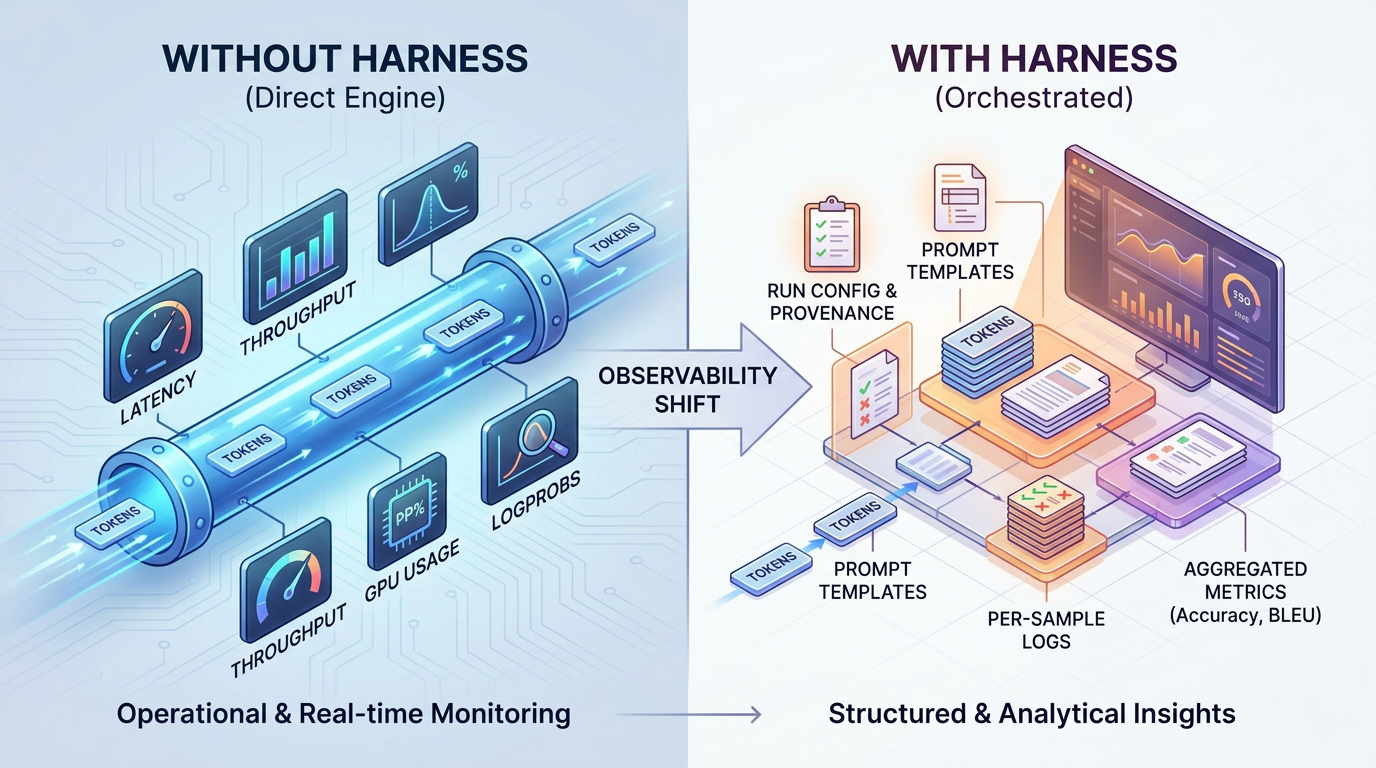
In machine learning and large language model (LLM) serving architectures, the distinction between a harness (often called an evaluation harness, benchmarking harness, or application harness) and a bare/direct inferencing engine lies in the layer of abstraction, responsibility, and pipeline orchestration.
Here is a breakdown of how both concepts work and how they differ:
1. The Inferencing Engine (Standalone / Direct)
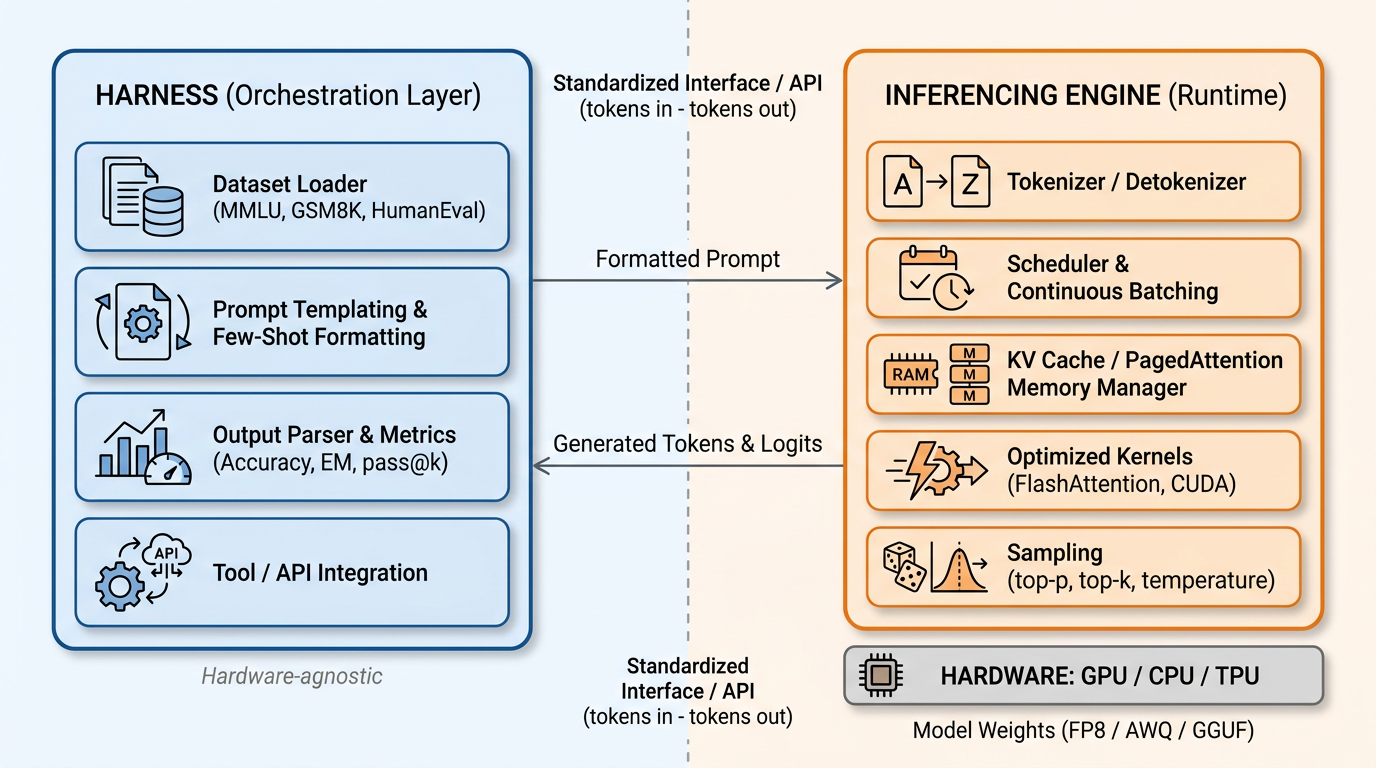
The inferencing engine is the low-level, high-performance execution runtime responsible for loading model weights into hardware (GPU, CPU, TPU, NPU) and computing the model’s mathematical forward pass.
When you use an inference engine without a harness, your code interacts directly with the runtime engine or its immediate API.
Core Responsibilities:
- Hardware Execution & Kernel Optimization: Computes matrix multiplications, attention mechanisms, and activation functions using optimized kernels (e.g., FlashAttention, TensorRT, CUDA, ROCm).
- Memory & KV Cache Management: Manages GPU VRAM, PagedAttention, and KV caching across tokens and concurrent batches.
- Batching & Scheduling: Handles continuous/dynamic batching to maximize hardware throughput across multiple concurrent requests.
- Token Generation: Handles tokenization, logit generation, and decoding strategies (e.g., greedy search, top-p, top-k, beam search, temperature scaling).
Common Examples:
- vLLM, TGI (Text Generation Inference), TensorRT-LLM, llama.cpp, Ollama, ONNX Runtime, Triton Inference Server.
Typical Workflow (Without a Harness):
Input Prompt -> Tokenizer -> Inferencing Engine (Forward Pass & Sampling) -> Detokenizer -> Raw Output
2. The Harness (Wrapper & Orchestrator)
A harness is an abstraction layer that wraps around one or more inference engines (or APIs). It does not compute matrix multiplications itself; instead, it automates the end-to-end workflow surrounding the model, such as dataset management, prompt formatting, metric computation, safety guardrails, or multi-step tool execution.
Harnesses are most commonly seen in two contexts:
- Evaluation & Benchmarking Harnesses: (e.g., EleutherAI LM Evaluation Harness, HELM, Promptfoo)
- Application / Agent Harnesses: (e.g., LangChain, LlamaIndex, Semantic Kernel, guidance/DSPy)
Core Responsibilities:
- Engine Abstraction: Provides a standardized interface so you can swap out the backend (e.g., test the same prompt/dataset across OpenAI API, Anthropic API, vLLM, and llama.cpp without changing test logic).
- Prompt Templating & Few-Shot Formatting: Formats system instructions, few-shot examples, chain-of-thought instructions, and user inputs dynamically.
- Dataset Ingestion & Batch Orchestration: Feeds standard datasets (e.g., MMLU, GSM8k, HumanEval) through the model systematically.
- Output Parsing & Metric Evaluation: Extracts answers, runs regex or unit tests on generated code, calculates exact match (EM), BLEU, ROUGE, or log-likelihood scores.
- Environment & Tool Integration: Handles external API calls, database lookups, and conversational state loops before passing context back to the inference engine.
Summary of Key Differences
| Feature / Dimension | Inferencing Engine (Direct) | Harness (Wrapping the Engine) |
|---|---|---|
| Primary Purpose | High-throughput, optimized model computation and token generation. | Workflow automation, evaluation, benchmarking, or application logic. |
| Level of Abstraction | Low-level (closest to the GPU/hardware and model weights). | High-level (wraps the model runtime or API). |
| Hardware Awareness | Deeply hardware-aware (manages VRAM, CUDA streams, KV caches, compute kernels). | Hardware-agnostic (treats the engine as a black-box text/token generator). |
| Data & Datasets | Processes whatever tensor or token stream is directly passed to it. | Loads, formats, slices, and iterates over entire benchmark datasets or user workflows. |
| Scoring & Metrics | Produces logits, probabilities, and raw token outputs. | Computes accuracy, F1, exact match, latency metrics, cost analysis, or pass@k rates. |
| Extensibility | Swapping hardware backends, quantization types (e.g., FP8, AWQ, GGUF), or model architectures. | Swapping models, providers, prompt templates, and evaluation criteria seamlessly. |
When to Use Which?
- Use the Inferencing Engine Directly when building a high-performance production API service where minimal latency and maximum token throughput are critical, and your service handles prompt assembly and logic upstream.
- Use a Harness when evaluating/comparing different models on benchmark datasets, testing prompt regressions across releases, or coordinating complex agentic workflows that require external tool execution and structured evaluation.
The layers
What the hardware layer is
It’s the physical compute substrate — the silicon that actually executes the model’s arithmetic:
- GPU (NVIDIA H100/H200/B200, AMD MI300X): massively parallel SIMT cores plus tensor cores, high-bandwidth memory (HBM). The default for LLM inference because attention and matmuls are bandwidth- and parallelism-bound.
- CPU (x86/ARM): fewer, faster general-purpose cores with large system RAM. Used for small/quantized models,
llama.cpp-style local inference, and always used for the surrounding orchestration (tokenization, scheduling logic, request handling). - TPU / NPU / other accelerators (Google TPU, AWS Inferentia/Trainium, Apple Neural Engine, Qualcomm NPU): ASICs built around systolic-array matmul units, often with their own compilers (XLA, Neuron).
What lives here: model weights loaded into device memory, the KV cache occupying VRAM/HBM, the compute kernels, and the interconnect (NVLink, PCIe, InfiniBand) that makes tensor/pipeline parallelism across multiple chips possible.
Its relationship to the two layers
Tightly coupled to the inference engine — effectively inseparable.
The engine is the piece that targets specific hardware. It is compiled or configured against a vendor stack (CUDA, ROCm, XLA, Metal, oneDNN), and its central design problems are all hardware-defined:
- Which quantization formats are even possible (FP8 needs Hopper-class or newer; MXFP4 needs Blackwell)
- How much KV cache fits, which sets max batch size and context length
- Whether a given kernel (e.g., FlashAttention-3) exists for that architecture
- How to shard a model across N devices given the interconnect topology
This is why engines are not universally portable: TensorRT-LLM is NVIDIA-only, llama.cpp spans CPU/Metal/CUDA, vLLM supports CUDA plus ROCm and TPU backends. Change the hardware and you often must change or recompile the engine.
Decoupled from the harness — by design, but not immune to it.
The harness treats everything below the API boundary as a black box: it sends a prompt, gets tokens back. Nothing in a dataset loader, prompt template, or scoring function needs to know whether an H100 or a TPU produced the output. That abstraction is precisely the harness’s value — the same eval suite runs against a local GGUF model on a laptop and a hosted API.
Two important caveats, though:
- Results are not fully hardware-invariant. Different kernels, reduction orders, and precisions produce slightly different logits. The same model on different hardware can yield non-identical outputs and marginally different benchmark scores — a real reproducibility concern in evaluation.
- Performance metrics are entirely hardware-dependent. If your harness measures latency, throughput, tokens/sec, or cost-per-token, those numbers describe the hardware + engine combination, not the model. Only correctness metrics (accuracy, exact match, pass@k) are approximately portable.
The stack in one line
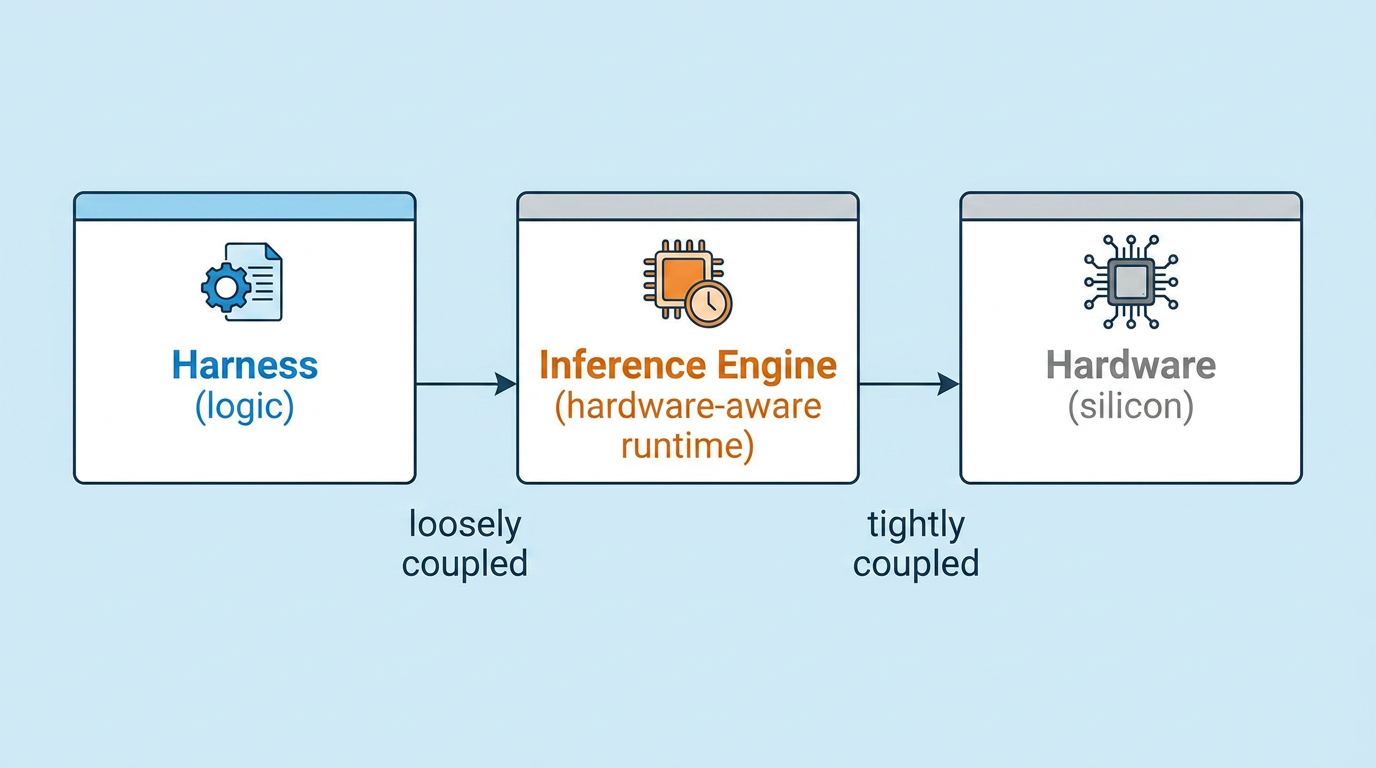
So: the hardware is a dependency of the engine, and only an indirect concern of the harness, visible to it through performance numbers and minor numerical drift, but never through its code.
How tokens flow WITH NO harness
Without a harness, you are the harness — your application code does what the harness would have done, and the engine’s public API becomes your only surface. The pipeline doesn’t change; the ownership of each step does.
1. Prompt assembly (your code). You build the string or message list yourself, including the chat template. This is the most common failure point when dropping the harness: engines like vLLM apply the model’s Jinja chat_template only on the /chat/completions path. If you call /completions or LLM.generate() with a raw string, no template, no BOS handling, no special tokens — the model silently receives malformed input and quality degrades without an error.
2. Tokenization. Handled inside the engine (HF tokenizers, SentencePiece, or llama.cpp’s built-in vocab), running on CPU. You can also pre-tokenize and pass prompt_token_ids directly, which is how you get exact control over special tokens.
3. Prefill. All prompt tokens go through the forward pass in parallel; the resulting keys/values are written into the KV cache (paged blocks in vLLM). This is compute-bound and produces the first-token latency.
4. Decode loop. One forward pass per token, each attending over the cached KV. Memory-bandwidth-bound. The scheduler interleaves your request with others via continuous batching, so wall-clock latency depends on concurrent load you don’t control.
5. Sampling. Logits → logit processors (repetition penalty, logit bias, grammar/JSON constraints) → temperature/top-k/top-p → sampled token ID. Loop back to step 4 until EOS, stop string, or max_tokens.
6. Detokenization and parsing (your code). The engine streams text back; extracting the answer, validating JSON, running the unit test, computing the score — all yours now.
Capturing observability
Yes, and arguably you get better signal than a harness gives you, because you can instrument at the engine boundary rather than above it.
Ask the engine for token-level data. This is the cheapest and most direct route:
1
2
3
4
5
6
7
8
9
10
11
12
from openai import OpenAI
client = OpenAI(base_url="http://localhost:8000/v1", api_key="x")

r = client.chat.completions.create(
    model="my-model",
    messages=[{"role": "user", "content": "Explain KV cache."}],
    logprobs=True,
    top_logprobs=5,          # per-token alternatives + probabilities
    stream_options={"include_usage": True},
)
print(r.usage)               # prompt_tokens, completion_tokens, total_tokens
print(r.choices[0].finish_reason)   # "stop" | "length" | "tool_calls"
logprobs gives you per-token confidence — the basis for hallucination detection, entropy-based uncertainty scoring, and perplexity. finish_reason tells you whether you truncated. usage gives cost accounting.
Scrape engine-native metrics. vLLM and TGI both expose a Prometheus /metrics endpoint. The fields that matter:
| Metric | What it tells you |
|---|---|
time_to_first_token_seconds | Prefill latency / queue pressure |
time_per_output_token_seconds | Decode speed (inverse of tok/s) |
num_requests_running / _waiting | Whether you’re saturated |
gpu_cache_usage_perc | KV cache pressure — the real capacity ceiling |
num_preemptions_total | Requests being evicted and recomputed |
prefix_cache_hit_rate | Whether prompt-prefix reuse is working |
Pair with nvidia-smi dmon or DCGM Exporter for SM utilization, HBM bandwidth, power, and thermals.
Trace the request path. vLLM supports OpenTelemetry (--otlp-traces-endpoint), emitting spans for queue time, prefill, and decode. Wrap your own code in spans and you get one trace spanning application logic and engine internals — something a harness typically cannot show you.
Log structurally, at the token layer. Persist per-request: prompt hash, exact prompt_token_ids, sampling params, seed, model revision, engine version, output token IDs, logprobs, timings. Token IDs rather than text is the important detail — it’s what makes a run reproducible and lets you diff two runs that render identically as strings but tokenized differently.
Bolt on an LLM-observability layer. Langfuse, Phoenix/Arize, Helicone, and OpenLLMetry all work as a thin proxy or decorator around the OpenAI-compatible client, so you keep direct-engine performance while getting trace UIs, cost dashboards, and eval hooks. Helicone in particular needs only a base-URL change.
What you actually lose
Not observability — that’s fully recoverable, and richer. What you lose is the standardized comparison layer: dataset iteration, canonical few-shot formatting, and metric definitions that match published numbers. If you hand-roll MMLU scoring, your result is not comparable to anyone else’s. So the practical pattern is: direct engine for production serving with your own instrumentation, harness for anything you intend to compare against a leaderboard.
How tokens flow WITH a harness
The engine-side steps (tokenize → prefill → decode → sample) are byte-for-byte identical. What changes is that a defined layer now sits above the API boundary and owns the steps your application code owned before. The flow becomes:
1. Task/dataset load. The harness pulls a task definition — dataset split, doc-to-text function, target field, metric, number of few-shot examples. In lm-eval-harness this is a YAML task config; in an agent harness it’s a chain/graph definition.
2. Request construction. For each document, the harness renders the prompt from a template, samples few-shot examples from a fixed pool with a fixed seed, and emits a typed request object rather than a raw string. This is the key structural difference: lm-eval emits loglikelihood, loglikelihood_rolling, or generate_until request types, and the request type determines what the engine is asked to do.
3. Model-adapter dispatch. The harness hands requests to a pluggable backend (hf, vllm, openai-completions, local-chat-completions). The adapter is where chat templating, batching, and API translation happen — so identical task logic can hit a local GPU or a hosted API.
4. Engine execution. Now conventional: prefill, KV cache, continuous batching, decode, sampling. Note that for multiple-choice tasks the harness often requests no generation at all — just the log-likelihood of each candidate continuation, a single forward pass per option, scored and compared.
5. Response collection and post-processing. The harness applies filter pipelines: regex extraction, take_first, majority vote across n samples, code extraction and sandboxed execution.
6. Metric aggregation. Per-doc scores roll up into accuracy, acc_norm (length-normalized), exact match, pass@k, BLEU — plus bootstrap standard error.
7. Artifact emission. A results JSON plus, optionally, per-sample logs.
How that is observable
Harness observability is run-scoped and structured, whereas direct-engine observability is request-scoped and operational. You get provenance and reproducibility rather than GPU telemetry.
Per-sample logging is the primary instrument. In lm-eval:
1
2
3
4
5
6
7
lm_eval --model vllm \
  --model_args pretrained=meta-llama/Llama-3.1-8B-Instruct,dtype=bfloat16 \
  --tasks gsm8k,mmlu \
  --num_fewshot 5 \
  --log_samples \
  --output_path ./results/ \
  --seed 1234
--log_samples writes, for every document: the fully rendered prompt, the raw model response, the filtered/extracted answer, the gold target, the per-doc metric value, and the log-likelihoods of each choice. That is the artifact you actually debug with — most “the model is bad at this task” findings turn out to be a template or answer-extraction bug visible in these logs.
The results JSON carries a config fingerprint. Model name and revision, model_args, dtype, batch size, num_fewshot, task versions, harness git hash, seeds, and elapsed time. This is what makes a score citable; without it a number is meaningless.
| Signal | Where it comes from | What it answers |
|---|---|---|
| Per-doc score + gold vs. predicted | --log_samples output | Which items failed, and why |
| Rendered prompt | Sample logs | Is the chat template / few-shot format correct |
| Log-likelihoods per choice | Sample logs (MC tasks) | Was it a near-miss or confidently wrong |
| Filtered vs. raw response | Sample logs | Is the answer extractor dropping valid answers |
| Bootstrap stderr | Results JSON | Is the gap between two models real |
| Config fingerprint | Results JSON | Is this run reproducible/comparable |
Agent/application harnesses observe via tracing instead. LangChain, LlamaIndex, and DSPy emit callbacks per step, so Langfuse, Phoenix, or LangSmith render a nested trace: chain span → prompt span → LLM call span → tool call span, each with token counts, latency, and cost. For multi-step agents this is the only practical way to see where a run went wrong, since the failure is usually a bad intermediate step rather than a bad final token.
Engine telemetry still exists underneath. The Prometheus /metrics endpoint, DCGM, and OpenTelemetry spans don’t disappear — the harness simply doesn’t surface them. Scraping the engine while a harness run executes is the standard way to get correctness and throughput in one picture.
The tradeoff, stated plainly
| With harness | Direct engine | |
|---|---|---|
| Observability shape | Run-level: scores, prompts, provenance | Request-level: latency, KV pressure, logprobs |
| Reproducibility | Built in (seeds, versions, task configs) | You must log it yourself |
| Comparability to published numbers | Yes | No, unless you replicate exactly |
| Visibility into GPU/hardware behavior | None by default | Full |
| Per-token logprobs | Only if the adapter requests them | Directly available |
So the harness buys you scientific observability and costs you systems observability — which is why production setups typically run both: harness for release-gating evals, direct instrumentation for the serving path.
Analysis drawn from enterprise AI FinOps research published in 2025-2026, including studies on AI budget overruns, LLM unit economics, observability-driven cost attribution, and emerging GenAI cost management platforms.
*References: Inference engine / hardware layer / observability metrics
- vLLM — Metrics design doc — confirms the Prometheus-compatible
/metricsendpoint and thevllm:prefix, and the server-level vs. request-level metric distinction I described (“server-level metrics explain why the request-level metrics are what they are”). - vLLM — Production Metrics — confirms the exact metric names I cited:
vllm:time_to_first_token_seconds,vllm:time_per_output_token_seconds,vllm:num_requests_running/_waiting,vllm:gpu_cache_usage_perc,vllm:num_preemptions_total,vllm:gpu_prefix_cache_hit_rate. - Correction from this source: in the V1 engine the KV-cache gauge is now
vllm:kv_cache_usage_perc(0–1 fraction);gpu_cache_usage_percis the v0 name. Also, per the design doc,prefix_cache_hit_rateis listed under deprecated metrics. - Monitoring vLLM in Production (Krisanov) — independently supports the observability-boundary point I made in the hardware answer: engine metrics do not describe the full request path; you need gateway + vLLM + GPU/host metrics together.
- The same page also confirms
--otlp-traces-endpoint-style OpenTelemetry tracing exists in vLLM (the design doc has a “Tracing - OpenTelemetry” section).
Harness / token flow / harness observability
- EleutherAI lm-evaluation-harness README — confirms the request types I described (
generate_until,loglikelihood,loglikelihood_rolling,multiple_choice), the pluggable backends (hf,vllm,openai-completions,local-chat-completions), and that models without logprobs are restricted togenerate_until. - lm-evaluation-harness task_guide.md — confirms YAML task configs,
doc_to_text/doc_to_targetJinja2 templating,num_fewshot,output_type,metric_list, and thefilter_listpipeline withregex,take_first, andmajority_vote— exactly the post-processing chain I described. - The task guide also confirms my reproducibility claim in its own words: YAML configs plus the codebase commit hash are “intended to be shareable such that providing the YAML config enables another researcher to precisely replicate the evaluation setup.”
- DeepWiki: lm-evaluation-harness — confirms the
Instanceobject carrying prompt + request type, i.e. the “typed request object” step. - LLM evaluation with lm-evaluation-harness (Kuo, Medium) — shows an actual
--log_samplesJSONL record containingdoc,target,arguments(rendered prompt),resps,filtered_resps, andexact_match. This validates the per-sample logging fields I listed.